The Context Diagram is the place to start when doing your analysis. It should be done in conjunction with the stakeholders that are most knowledgeable about the business processes for the domain under study. The initial list of Business Events will be derived from the Context Diagram.
Start with a circle in the middle of the diagram. This represents the area of the business in the scope of the project. All of the processes within this circle are in scope and are able to be modified or added to as part of the project scope. Think of it as if this business function were outsourced to a service provider and the Executive Sponsor of the project is the CEO of this service provider. What would they need to know to create a business model?
First, you would want to define “who are my Customers?”. Your Customers are recipients of your business’s outputs (in most projects, these are flows of information and data). Ask the key stakeholders “who are the current recipients of information your business function?”. Draw the Customers as rectangles on the right hand side of the diagram. It is not important at this time that you have the complete list of Customers, only that you have some. We will complete the list of Customers in an iterative process in conjunction with the Event/Response Model.
Next, define the types of information that flow to each Customer. Draw these as arrows from the center circle and connecting to the Customer rectangle. Have a short, high level description of the flow on each arrow.
After that you need to define “who are your Suppliers?”. The Suppliers are providers of the business’s information and data. Ask the key stakeholders “who are the current providers of information for your business function?”. Draw the Suppliers as rectangles on the left hand side of the diagram. It is not important at this time that you have the complete list of Suppliers, only that you have some. We will complete the list of Suppliers in an iterative process in conjunction with the Event/Response Model.
Next, define the types of information that flows from each Supplier. Draw these as arrows from the Supplier rectangles and connecting to the center circle. Have a short, high level description of the flow on each arrow.
Rules for Suppliers and Customers:
- They can be individuals, roles, departments, organizations, systems, vendors, etc. Anything that is a net originator or receiver of data or information from your “business”.
- Some entities can be both Suppliers and Customers. so they will have arrows going in both directions.
- If you are struggling with whether a Supplier or Customer is inside or outside the circle, the general rule is for entities outside the circle, the project has no control over their processes. The project can only change the nature and content of the information flows to and from these entities.
- There are no flows represented that go from entity to entity. They may exist but they are of no concern to the project.
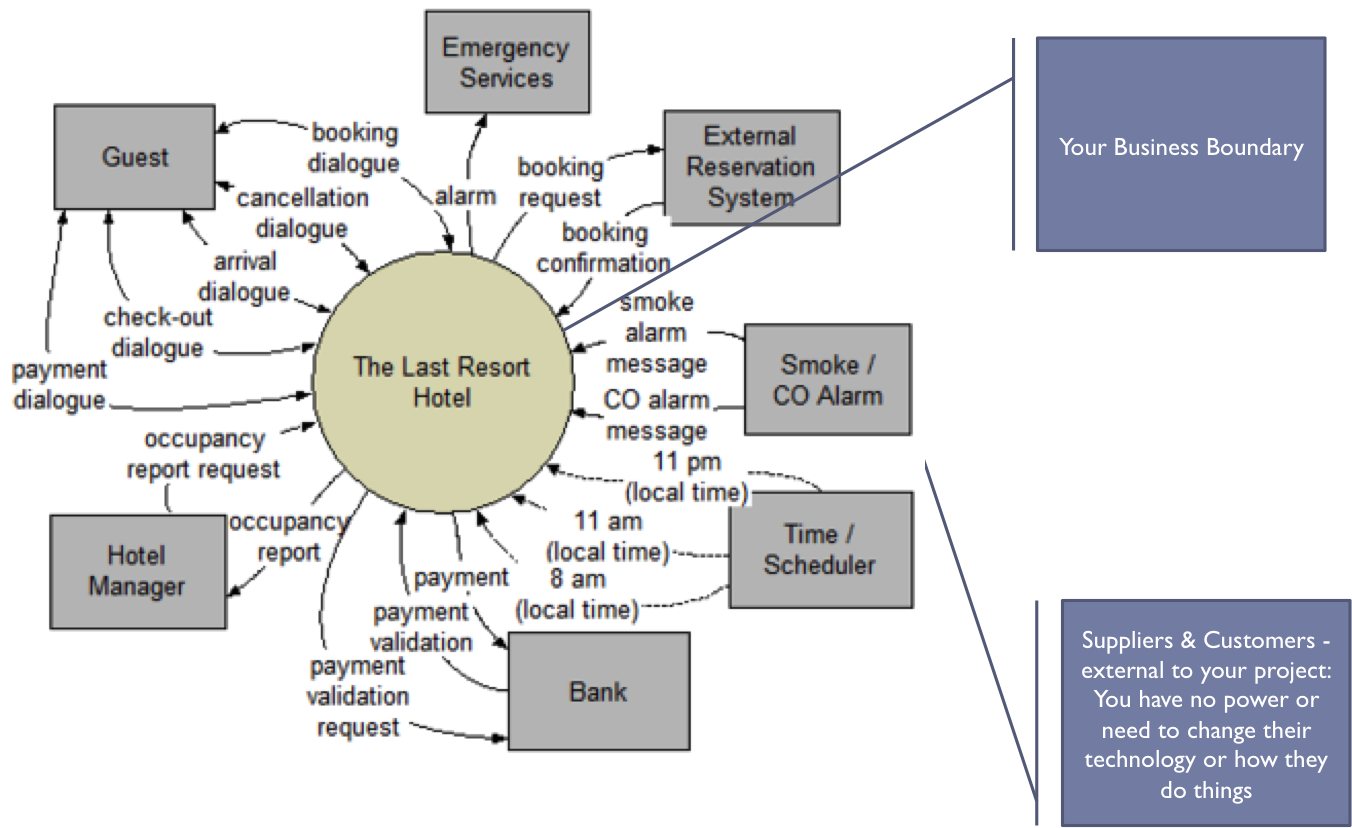
Here is an example of a Context Diagram: